Pages

Wednesday, June 4, 2014

BQ #7: Explain in detail where the formula for the different quotient comes from now that you know! Include all appropriate terminology (secant line, tangent line, h/delta x, etc).


We have known about the difference quotient for a long time now; in fact, it is often included in our tests. However, we really didn't know where it came from until we reached the last unit- Unit V! So let's take a closer look at how the difference quotient is derived.
Based on the first few concepts, we know that the difference quotient is only a part of the process when trying to find the derivative (the slope of tangent lines).

http://t3.gstatic.com/images?q=tbn:ANd9GcQx-jY-1cjcu_PSC9gGtoDW4qMYafVwaqWw8Qt5qV_gQpIKlz5w:cis.stvincent.edu/carlsond/ma109/DifferenceQuotient_images/IMG0470.JPG
Notice that the image on the left shows us two  main points. The first point is [x, f(x)]because the first value on our scale was "x". Since the first value under the x-axis is "x" that means that the value for y in that point is f(x).  There is another point, but does not have exact digits either. Therefore, we simply add the "h" (the distance between the two points) to the already known "x", so we can get "x+h". Then as we did before, the y-axis will be f of the x-axis, which turns out to be f(x+h).
http://t2.gstatic.com/images?q=tbn:ANd9GcSmctLWns4VWjJOvK672RQnfSPeu-73rvYghAvuGT_HhHTEhVRY3w:education-portal.com/cimages/multimages/16/Slope_formula_2.png

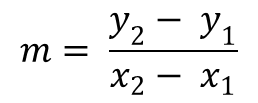
We continue to find the difference quotient by using the slope formula as shown above. After plugging in the values based on the slope formula we get [ f(x+h)-f(x)/ x+h-x]. Since the "x" in the denominator cancel out, we only have to simplify it to get [f(x+h) -f(x)/ h]....the difference quotient!!
Like I mentioned before, the difference quotient can be used to find the slope of a tangent line, which only touches the function once. We do not have to rely on the secant line because it touches the function twice. As a matter of fact, the reason why we try to find the limit as h approaches 0 is because we want "h" to be as close as possible to 0 so that both points can meet at one point instead of two like the secant line).


Monday, May 19, 2014

BQ #6- Unit U

What is continuity? What is discontinuity?

A continuity is basically a predictable graph  or a continuous graph.  A continuity is also described as a graph that "has no breaks, no holes, and no jumps". Another way you can identify a continuity is by drawing it without lifting  your pencil from the paper and makes a goof bridge. We are more familiar with continuities as we dealt with them in parabolas, linear graphs, etc. Meanwhile, discontinuities are the opposite of continuities since they do have holes, jumps, and breaks. Discontinuity graphs are categorized into two different "families". The two families are removable discontinuities and non- removable discontinuities. In removable discontinuities, the one example would be point discontinuities, or a hole. Non-removable discontinuities have three different examples: jump discontinuities, oscillating behavior, and infinite discontinuity. Jump discontinuities are graphs that have an open and closed circle, but do not connect. An oscillating behavior is a graph that looks sine curve, but is very wiggly. An infinite discontinuity is also known as unbounded behavior because it occurs where there is a vertical asymptote.

Removable Discontinuity:

Point Discontinuities

http://dj1hlxw0wr920.cloudfront.net/userfiles/wyzfiles/4a69dec7-03e0-492f-ac16-4dcd555579c9.gif
Non-Removable Discontinuities

Jump Discontinuity
http://upload.wikimedia.org/wikipedia/commons/thumb/9/92/Jump_discontinuity_cadlag.svg/264px-Jump_discontinuity_cadlag.svg.png

Oscillating Behavior
https://encrypted-tbn3.gstatic.com/images?q=tbn:ANd9GcRGKnu-whU8KA1HjLrbu6pgV9JW_727lNXa-Eu-3sTzcp_zGqukDg

Infinite Behavior
https://encrypted-tbn2.gstatic.com/images?q=tbn:ANd9GcRp9ghtAEQLeV_IInaJpdPzTWbn-xansC05qQdrQ_6jz_yURt2TQQ

What is a limit? When does a limit exist? When does a limit not exist? What is the difference between a limit and a value?

A limit is "the intended height of a function". As for the values, it is the actual height of a graph. Keep in mind that a graph is continuous when the limit and the value are the same and we have no discontinuity. So now let's go back, where does a limit exist/ not exists?
A limit exists in any point within a continuous function and also exists in a hole because the graph still intended to reach a certain height. As for the value, the random point above would be the actual value since it is the actual height of the function (dark circle).
Analogy of why the limit still exists in a hole:
Two people are driving to a restaurant from two different routes. Once they get there, they noticed that the restaurant burned down. Despite the fact that they did not go inside the restaurant, the two different people still reached the intended destination- the restaurant.
http://dj1hlxw0wr920.cloudfront.net/userfiles/wyzfi
However, a limit will fail to exists in non-removable discontinuities, such as jump, oscillating, and infinite behaviors. The reason why a limit would not exist in a jump discontinuity is because there are different left and right limits. Also, the value and the jump discontinuity in jump discontinuities are different. When looking for the values, the value of a jump discontinuity would be the dark or closed circle. A limit will not exist in an oscillating graph because there are too many values within the "wiggly" graph that it is difficult to pinpoint one single value or limit. The last discontinuity in which a limit does not exist would be in infinite behavior graphs. This usually happens when we have a vertical asymptote, which would lead into unbounded behavior graphs. We will forever more approach infinity, which means we cannot find a specific numerical value.

How do we evaluate limits numerically, graphically, and algebraically? 
One of the ways to evaluate limits would be by using a table. We take the limit and add or subtract (1/10) to it.(three for the left and three for the right). Those two values would be the end points of the table and those f(x) values would approach the limit. 
The other way we can evaluate limits would be graphically. When we find values to our table, we can simply plug the function into the "y=" sceen and trace them. There are times when the limits are graphed and in those cases, it would be easier to trace the graph with our own fingers. If out fingers meet then the limit does exist, but it is doesn't then the limit does not exist. 
Lastly, we can also find the limits algebraically. We can evaluate algebraically with direct substitution, factoring out, and finding the conjugate. We always want to start solving with direct substitution, which is basically substituting the x value that we are approaching into the function. You can will be done with the problem if you get a # (or fraction), 0/#, #/0, or 0/0 (indeterminate). If you do get indeterminate, then use the next methods. When we factor out the function we should be able to cancel something out (removable) that would result in a simply number which we can directly substitute back into the function. The other method would be rationalizing/ conjugate and it is usually used when we have a radical and cannot factor out anything. We follow by multiplying by the conjugate of the portion that has a radical. We foil the conjugate and leave the non-conjugates alone. Again, we should be able to substitute once we canceled something else.

References
http://dj1hlxw0wr920.cloudfront.net/userfiles/wyzfi
https://encrypted-tbn2.gstatic.com/images?q=tbn:ANd9GcRp9ghtAEQLeV_IInaJpdPzTWbn-xansC05qQdrQ_6jz_yURt2TQQ
https://encrypted-tbn3.gstatic.com/images?q=tbn:ANd9GcRGKnu-whU8KA1HjLrbu6pgV9JW_727lNXa-Eu-3sTzcp_zGqukDg
http://upload.wikimedia.org/wikipedia/commons/thumb/9/92/Jump_discontinuity_cadlag.svg/264px-Jump_discontinuity_cadlag.svg.png
SSS Packet

Monday, April 21, 2014

BQ #4: Why is a "normal" tangent graph uphill, but a "normal" cotangent graph downhill?

Again, we are going to go back to the Unit Circle and as the unit circle tells us, the trig ratio for tan=y/x and cot= x/y since it's the reciprocal of tangent. Another way we can see these ratios is tan=sin/cos and cot= cos/sin.  Look that the paragraphs and the images for more details. With this in mind,  cos would need to equal 0 for tangent and sin would need to equal 0 for cotagent in order to find our asymptotes since they are undefined ratios.

For tangent, Cos would be 0 at 90* (pi/2) and 270* (3pi/2). Before we graph, also remember that the pattern for tangent will be  + - + -. Now, let's label our graph based on the quadrants and their pattern, but highlight where the asymptotes will lie on.
You can see that based on the asymptotes, you need to draw your graph within those two quadrant. It lies on the second quadrant , which is negative and then in quadrant three, which is positive. When you connect those two, your graph will go uphill.


Now as for cotangent, you also need to remember that in order to get an asymptote, sin will need to equal 0. Based on the unit circle, sin=0 at 0* (0pi) and 180* (pi). The pattern for cotangent is the same as it is for tangent ( +-+-). Once we label our graph and highlight the asymptotes, we need to look at the quadrants that lie within those asymptotes. We land on the first quadrant, which is positive and then in the second quadrant, which will be negative. Once we connect these pieces together, we get a downhill graph.


Friday, April 18, 2014

BQ#3 – Unit T Concepts 1-3


How do the graphs of sine and cosine relate to each of the others?  Emphasize asymptotes in your response.


Tangent: Sine and cosine are always two of the main trig functions. So how do both of them relate to the tangen graphst? First, let's remember that the trig ratio for tangent is sin/cos or (y/x). As you may remember, sine is positive in the 1st and 2nd quadrant, cosine in the 1st and 4th quadrant, and tangent in the 1st and 3rd quadrant. Meanwhile, sine is negative in the 3rd and 4th, cosine in the 2nd and 3rd, and tangent in the 2nd and 4th. Therefore, let's say we want to find the answer to tangent, we need to divide sine over cosine first and the sign of those trig functions will depend on the quadrant they lie. If we look at the 2nd quadrant, sine is positive and cosine is not, so a positive divided by negative will give us a negative answer. Do you see it now? The answer is negative in the 2nd quadrant and tangent is also negative in second quadrant. In the first quadrant, both are positive (sine and cosine), so then tangent is also positive. For the 3rd quadrant, both sine and cosine are negative, meaning that the answer will be positive (tangent is positive in the 3rd quadrant.) Lastly, in the 4th quadrant, sine is negative, but cosine is positive; nevertheless, the answer is negative, which means that tangent is also negative. Tangent will continue to go uphill based on these values
As for the asympotoes, tangent also derives it's distance between the asymptotes from sine and cosine. If tangent= sine/cos, the only way to get an asymptote (undefined ratio) is to let cos(x)=0 (denominator 0= undefined). According to the unit circle, the two values that give is cosine (x) as 0 would be at \pi \!\,/2 and at 3\pi \!\,/2.  Of course, the aysmptotes do not end there because they will continue to go on forever, never touching the asymptoes; yet, sine and cosine will be there to help us find tangent.

Cotangent:

Cotangent is related to sine and cosine is a very similar way as it is related to tangent. The difference between the ratios is that now it's the reciprocal and cotangent: cosine/sine. Regardless of that, the signs for each trig function remain the same in given any quadrant. For example, in quadrant 1, cosine (+)/ sine (+) will give us a positive answer, which is similar to cotangent being positive in the 1st quadrant as well. In the 2nd quadrant, cos (-)/ sine (+), will lead to a negative number very much similar to cotangent being negative in the 2nd quadrant. Keep in mind that cotangent is positive in the 3rd quadrant, so when we divide cos (-)/ sin(-), then we also get a positive answer. Then for the last quadrant, cos(+)/ sin (-) give us a negative answer, which is what cotangent is in the 4th quadrant.
Similar to tangent, the denominator for cotangent also need to be 0 in order to get an asymptote. In other words, we need a value that has sin of theta equal to 0 since that would result in an undefined ratio. The values that have the y value as 0 would be 0 and 2\pi \!\,. Given the location of the asymptotes, we can start up for the 1st quadrant and then go down for the second quadrant, meaning that this time the graph will be downhill.


Secant:

Secant is much easier because it is the reciprocal of cosine, so that means that the ratio for secant is 1/cosine. Since cosine is the denominator, that means that the only want to get an aymptote would be to make cosine equal 0. So where does cosine equal 0? It equals  0 in \pi \!\,/2 and 3\pi \!\,/2 or at the 90* and 270*. This is also due to the fact that secant shares the same positive and negative values as cosine since they are reciprocal as I previously mentioned. Just so you can see it in action, let me show you an example. In the 2nd quadrant, cosine is negative so if we divide 1 (+) by cosine (-), then we get a negative answer similar to secant in the 2nd quadrant. The same method would be applied to secant as it can be applied to cosine. 


Cosecant:

Just as cotangent was similar to tangent, cosencant will be similar to secant. We must first understand that cosecant is the reciprocal of sine, so the ratio would be 1/sin. This means that in order to get the asymptotes, sine (denominator) would have to be 0 to give us an undefined ratio. In order to get sine to equal 0, the values for the asymptote would have to be 0 and 2\pi \!\,. Also, let us not forget that cosecant will also share the similar sign values as sine because they are both positive in the 1st and 2nd quadrant, but negative in the 3rd and the 4th quadrant. Also, both will continue to have many, many asymptotes even though we tend to only show one period.

References:
SSS Packet- Unit T
Demos Packet
Thursday, April 17, 2014

BQ #5: Unit T: Concepts 1-3: Why do sine and cosine NOT have asymptotes, but the other four trig graphs do?


So in order to figure out why sine and cosine do not have asymptotoes, we need to understand what an asymptote is. It is basically an undefined ratio, or a ratio that is divided by 0. Keeping that in mind, let's look at the trig ratios once again:


https://precalculusnwr7.wikispaces.com/file/view/Data_table_for_math_wikispaces.JPG/317767144/384x311/Data_table_for_math_wikispaces.JPG

http://staff.argyll.epsb.ca/jreed/math30p/trigonometry/unitCircle.htm


Notice how the only trig ratios to not have "r" are sine and cosine and "r" represent 1 on the unit circle. So whatever you divide sine and cosine by, the denominator will be 1 and therefore, it will not be undefined (asymptote). An asymptote can only exist when the denominator is 0 in order to reach the undefined value. Meanwhile, the other four trig graphs do not have a 1 as a denominator, meaning that they could have a 0 as a denominator to make it undefined and thus an asymptote. In order words, cosecant and cotangent can have asymptotes if the "y" (denominator) is equal to 0. This would apply to secant and tangent is the x is  also equal to 0.


Reference:
https://precalculusnwr7.wikispaces.com/file/view/Data_table_for_math_wikispaces.JPG/317767144/384x311/Data_table_for_math_wikispaces.JPG

http://staff.argyll.epsb.ca/jreed/math30p/trigonometry/unitCircle.htm

SSS Packet Unit T

Wednesday, April 16, 2014

BQ #2: Unit T: Concept Intro: How do trig graphs relate to the Unit Circle?

How do the trig graphs relate to the unit circle?
The Unit circle relates to the trig functions because it helps describe where the positive and negative sections of the graph come from, so that we can derive the periods of each trig function in order to graph it. When you look at the graph below, notice how the sine (Blue) is positive, which is basically covering the 1st and 2nd quadrant because sine is positive there. Then, it continues to go down to reflect that sine is negative in the 3rd and the 4th quadrant. As for cosine (Green), the positive uphill tells us that cosine is positive in the 1st quadrant and then goes down because cosine is negative in the 2nd quadrant. The downhill also shows that cosine is negative in the 3rd quadrant since it is still negative. It finally goes back up because cosine is positive in the 4th quadrant. The tangent graph (Orange) also goes through the similar situation, but according to the ASTC pattern as well. So first the graph starts in the 1st quadrant because all trig functions are positive there and it becomes negative since tangent is negative in the 2nd quadrant. It finally goes back up to a positive position because tangent is positive in the 3rd quadrant and then goes back to negative in the 4th quadrant.

Period? - Why is the period for sine and cosine 2pi, whereas the period for tangent and cotangent is pi?

Let's start by defining what a period is in order to understand how it relates to the graphs.
Period: The period for sine/cosecant and cosine/secant is 2\pi \!\, because it will take 4 quadrants (based on ASTC) to repeat the pattern (or one time to go through the cycle)

Sine is + + - -
http://geogebratube.com/student/m25914

Cosine is + - - +
http://geogebratube.com/student/m25914

Sine and Cosine may have an amplitude of 2\pi \!\,, the period for Tangent and Cotangent is simply \pi \!\, because tangent has a pattern on +-+- (based on ASTC).  In other words, it has a positive and then a negative within the first two quadrants.

 Tangent + - + -
http://geogebratube.com/student/m25914
 Remember, a period is only how much it take to go through the cycle even though it is never-ending; in fact, periods can continue on forever, but we only want to look at one period in order to understand how it relates to the trig functions.


Amplitude? – How does the fact that sine and cosine have amplitudes of one (and the other trig functions don’t have amplitudes) relate to what we know about the Unit Circle?

Amplitudes are half the distance between the highest and lowest points on the graph. All we need to look at is the value of "a" to find it (Kirch). So why is it that sine and cosine have an amplitude, but not tangent? Well, going back to the unit circle, sine and cosine both have "r", which equal 1 in their trig ratios. Sine and cosine have a restriction because they cannot have a value greater than 1 or less than -1. In fact, this would result in a "no solution". However, tangent/cotangent do not have 1 and are not restricted to 1 and can have other values that do not have to be in between -1 and 1.

https://share.ehs.uen.org/taxonomy/term/300


References:
https://share.ehs.uen.org/taxonomy/term/300
http://geogebratube.com/student/m25914
Unit T SSS Packet


Friday, April 4, 2014

Reflection 1: Unit Q Verifying Trig Functions

          1. Verifying trig functions are not easy at first,  I won't lie. However,  I know one can easily verify functions by following a series of steps. To verify a trig function basically means to prove how one can derive the trig based on another trig function.  Our goal is to simply,  find the conjugate,  etc. in order to find the answer. It usually takes a while, but you can start looking at thw hints that you are given.
          2. I usually start by looking at the similarities I  my problem.  For example, if I know that one of the trig function is an identity that can the canceled with another, I will find a way to cancel it out with ratio identities. I also try to turn everything into sin and cos.  One of the most common process I use is finding the conjugate for concept 5. For other simpler concepts, I tend to separate them and then proceed to cancel.
          3. My first step tends to be to look at the problem for anything that I can cancel off. In reality,  most times I just try anything because I willw eventually find the answer.  Then, I go into factoring anything needed and sometimes by doing so,  I can replace it by a Pythagorean identity. Once I can use my identies, I can continue finding other things that can be canceled. Mainly,  do not over think something because the answer might just be in front of you. Good luck!